Logistics & Supply Chain
Dashboards that keep your fleet moving.
We pull your TMS, telematics, fuel cards and spreadsheets into one live picture — so you can see utilisation, on-time delivery and cost without waiting on a Monday-morning report.
Sound familiar?
Data scattered across systems
TMS, ELD/telematics, fuel cards, WMS and spreadsheets never line up — so nobody trusts the numbers.
No real-time view of the fleet
Utilisation and on-time performance are only clear after the fact, when it’s too late to act.
Costs creep up unnoticed
Fuel, idle time and maintenance quietly erode margin because nobody’s watching the trend daily.
Reporting eats the week
Analysts rebuild the same spreadsheets every week instead of answering the questions behind them.
Dashboards built for logistics
Fleet & Asset Utilisation
Vehicles, trailers and capacity at a glance — spot idle assets and rebalance before they cost you.
On-Time Delivery & SLA
Track on-time rates, dwell and exceptions by lane, customer and depot against your SLAs.
Fuel & Maintenance Cost
Cost-per-mile, fuel efficiency and maintenance spend trended so overruns surface early.
Route & Lane Profitability
See which lanes and customers actually make money once fuel, miles and time are in.
Driver Performance & Safety
Harsh-braking, speeding and hours-of-service flags rolled up by driver and region.
Warehouse & Inventory Flow
Throughput, pick rates and stock turns connected end-to-end with your transport data.
Every metric that moves the needle
No more stitching spreadsheets together. The numbers your team argues about, in one place, refreshed automatically.
- On-time delivery %
- Cost per mile / per drop
- Fleet utilisation
- Fuel efficiency (MPG)
- Idle & dwell time
- Maintenance spend
- Lane & customer profitability
- Driver safety scores
We’ve built this before
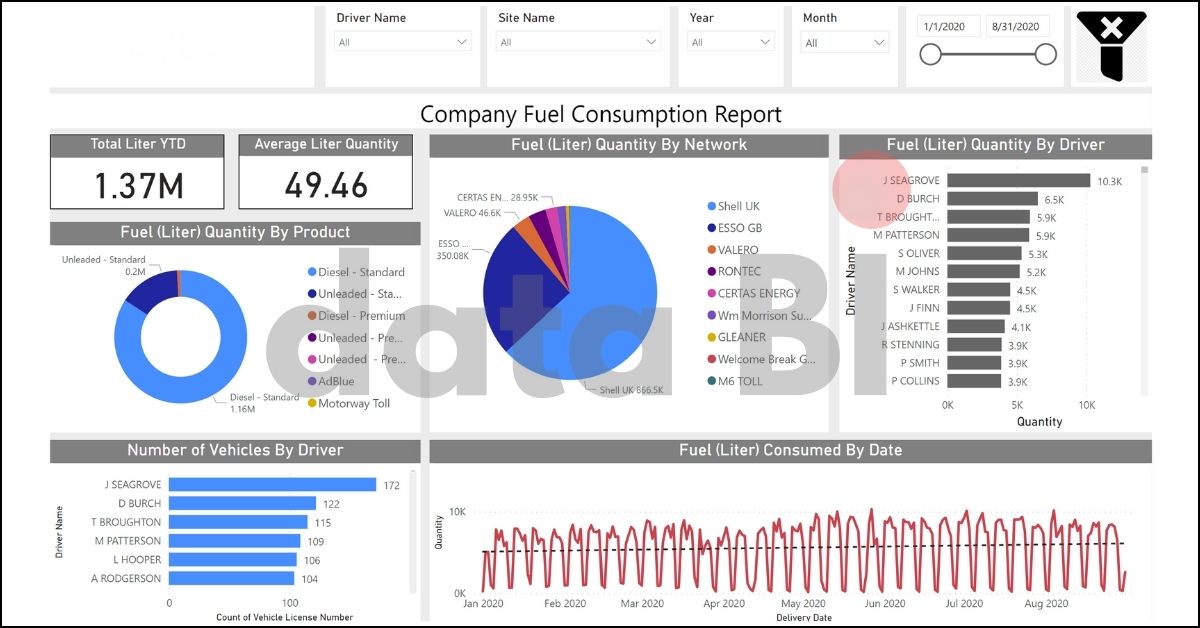
Company Fuel Consumption Report with Power BI
- Consolidated fuel-card and vehicle data into one report
- Fuel cost and efficiency trended by vehicle and period
- Outliers and overspend surfaced automatically
- 500+
- Projects delivered
- 20+
- Clients worldwide
- 4.9/5
- Average client rating
Logistics questions we get
Which logistics systems can you connect to?
TMS, ELD/telematics, fuel cards, WMS, ERP and plain spreadsheets — if it holds data, we can pull it in.
How fresh is the data?
As fresh as you need — from scheduled daily refreshes to near real-time, depending on your sources.
Can you handle multi-depot and multi-region operations?
Yes. Dashboards filter by depot, region, lane, customer or driver so each team sees what’s theirs.
Power BI or Tableau?
Either — we build in whichever fits your stack and licensing, and we’ll advise if you’re unsure.
Tell us about your data
Send a message or book a free strategy session. We reply within 24 hours.
- A clear plan for your dashboards & analytics
- Honest advice on Power BI vs Tableau for your stack
- No obligation, no sales pressure